

Over the past 30 days, crypto market participants have bridged more than $120 million in liquidity to Solana (SOL) from other blockchains, signaling renewed confidence in the network. Traders transferred the highest amount from Ethereum (ETH) at $41.5 million, followed by a $37.3 million influx from Arbitrum, according to data from Debridge.
Meanwhile, users on Base, BNB Chain and Sonic moved $16 million, $14 million and $6.6 million, respectively.
Total transferred amount from other chains to Solana. Source: debridge
The return of liquidity to Solana paints a stark contrast to the network’s recent challenges. Following Argentina’s LIBRA memecoin scandal, which ensnared President Javier Milei, Solana saw investors move $485 million to other blockchains like Ethereum and BNB Chain.
The current liquidity influx to Solana coincides with the return of double-digit price rallies from memecoins as POPCAT, FARTCOIN, BONK and WIF rose 79%, 51%, 25% and 21%, respectively, over the past seven days.
However, further analysis shows the total generated fees for March coming in just under $46 million. For context, Solana’s fees peaked at over $400 million in January 2025. Currently, the total fees generated for the month of April are roughly $22 million.
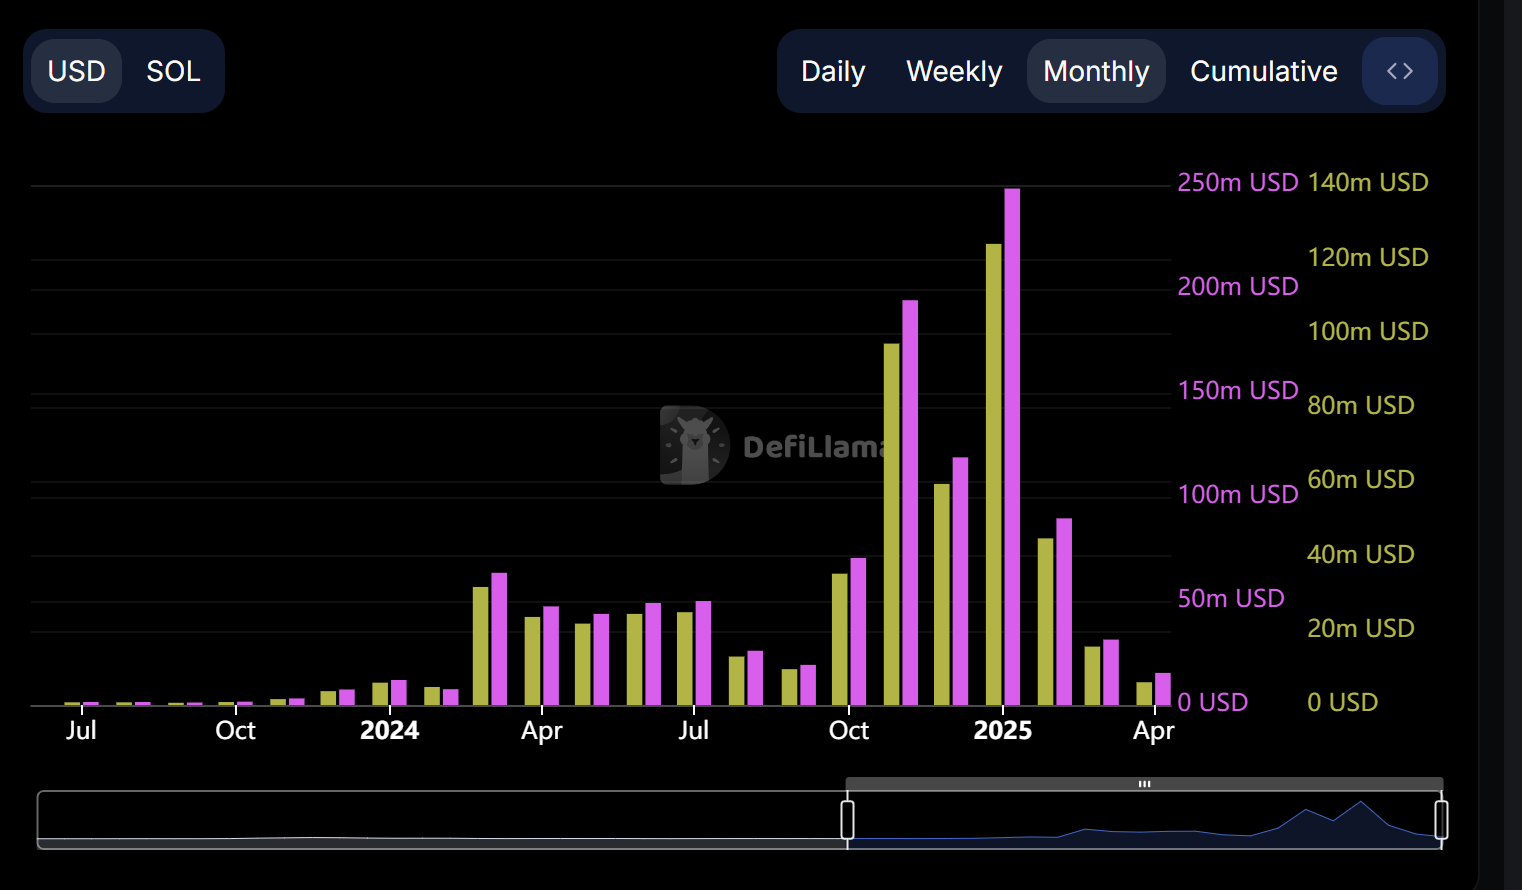
Solana total generated fees and revenue. Source: DefiLlama
Related: Spot Solana ETFs to launch in Canada this week
Solana price has a tough uphill climb ahead
From a technical perspective, Solana remains in a bearish trend on the 1-day chart. SOL must exhibit a bullish break of structure by closing a daily candle above $147 for a bullish trend shift.
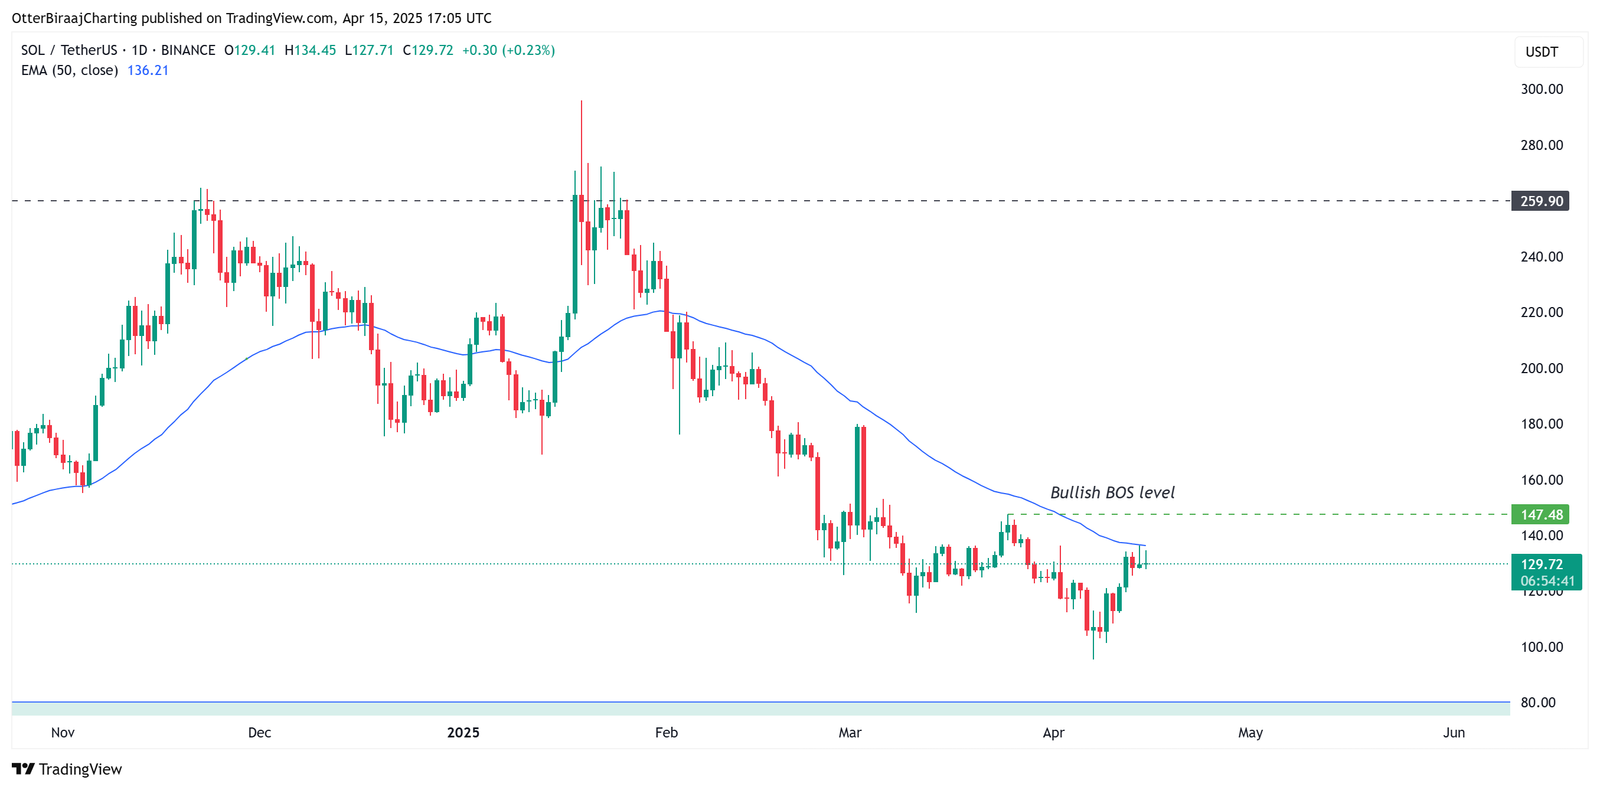
Solana 1-day chart. Source: Cointelegraph/TradingView
Solana remains under the $140 level, with the 50-day exponential moving average (blue line) acting as a strong resistance. A bullish close above the 50-EMA would have increased the likelihood of a positive trend reversal, but SOL prices have stalled at current levels.
On a lower time frame (LTF) chart, Solana exhibited a bearish divergence between the price and relative strength index (RSI) indicator. Historically, a bearish divergence setup has signaled a correction period for Solana in 2025. SOL has experienced four bearish divergences since January, each following a price decline.
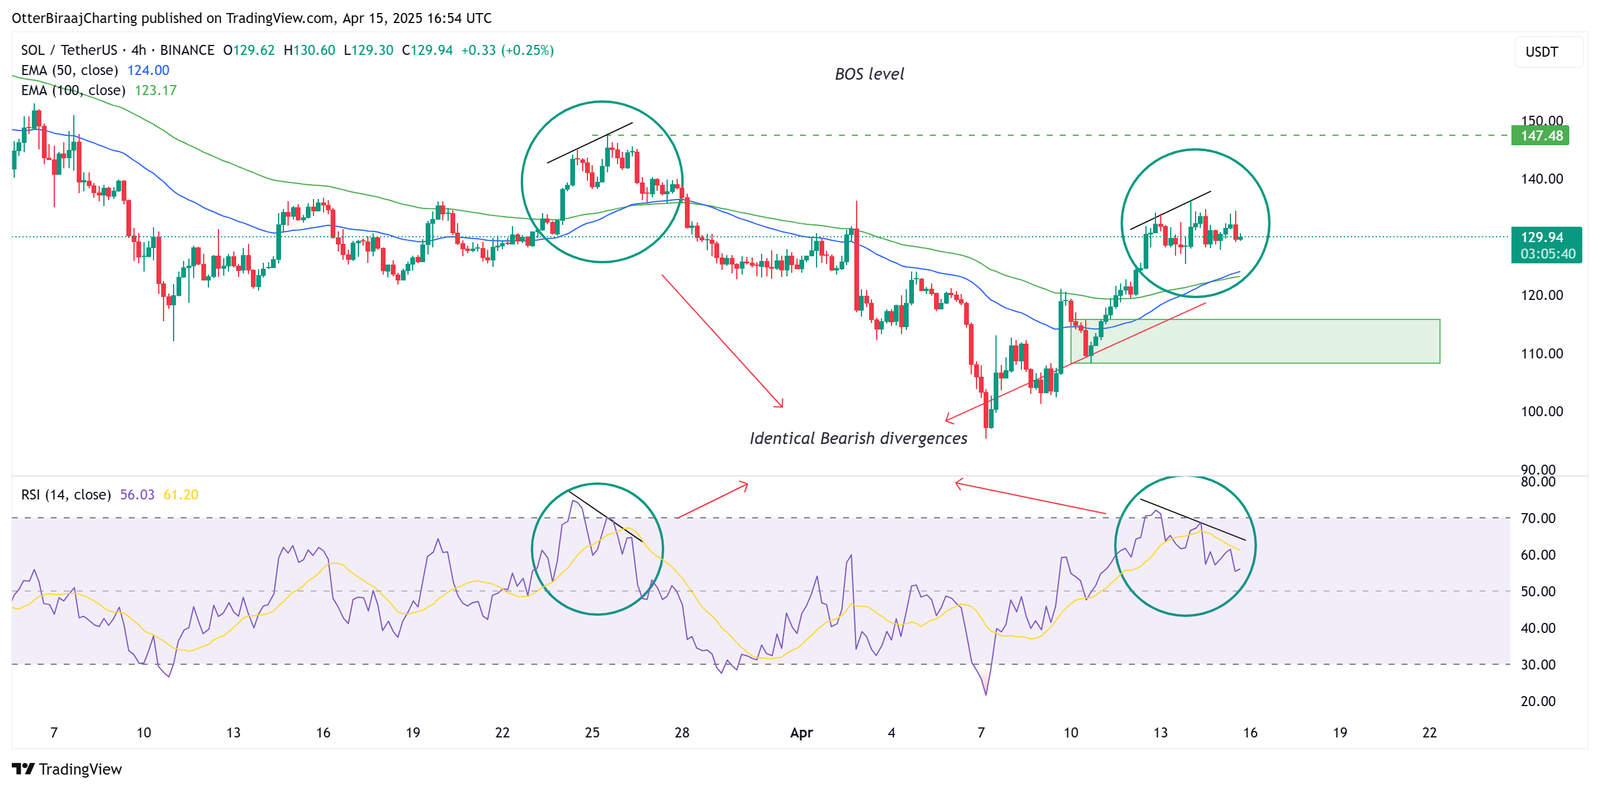
Solana 4-hour chart. Source: Cointelegraph/TradingView
There is a strong similarity between its previous and current bearish divergence. Both setups took place after the price moved temporarily above the 50-day and 100-day EMA (blue and green line) on the 4-hour chart, eventually leading to a price drop.
Thus, it is possible that Solana could follow a similar path in the next few days. The 1-day demand zone is the immediate area of interest for a bounce between $115 and $108.
Meanwhile, in a recent X post, Glassnode reported a significant shift in Solana’s realized price distribution, with over 32 million SOL bought at the $130 level over the past few days. That is 5% of the total supply, which means the $130 level could be a strong support level in the future. The analysis added,
“Below $129, we see 18M $SOL (3%) at $117.99, while above, 27M $SOL(4.76%) sit at $144.54. In the short term, $144 could act as resistance and $117 as the lower bound of the price range, with $129 serving as the key pivot zone.”
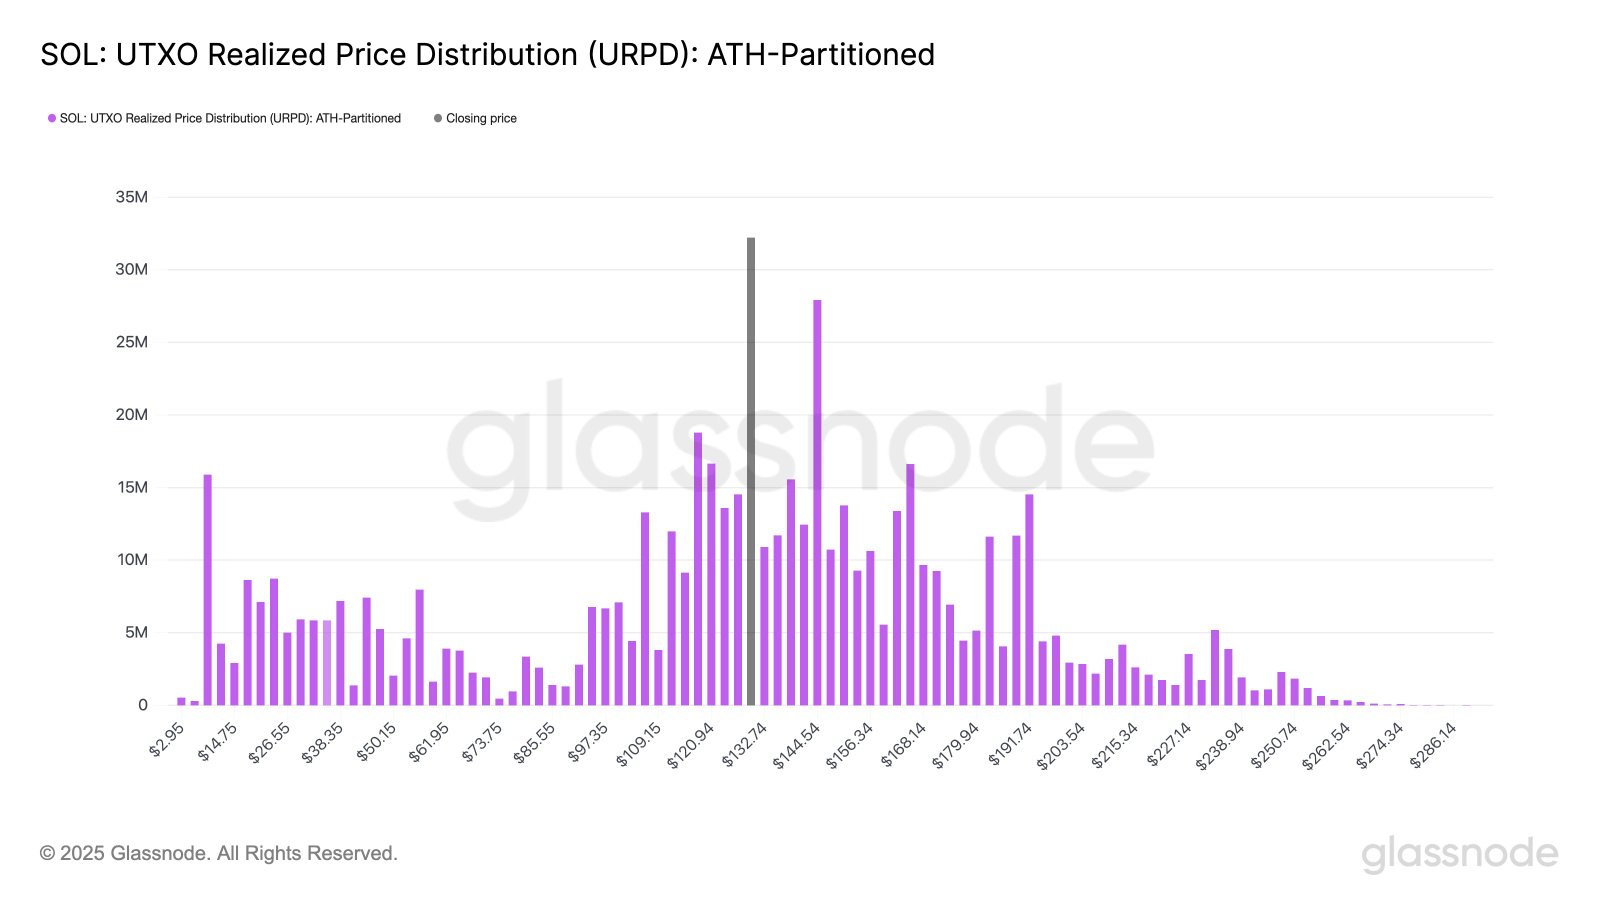
Solana UTXO realized price. Source: Glassnode
Related: Bitcoin price recovery could be capped at $90K — Here’s why
This article does not contain investment advice or recommendations. Every investment and trading move involves risk, and readers should conduct their own research when making a decision.