

XRP (XRP) price fell 22% between March 19 and March 31, potentially forming a local bottom at $2.02. The price then increased by 9% to $2.20 before retracing to the current levels.
Has the popular altcoin finally bottomed out, or is there a deeper retracement in the cards?
XRP bullish divergence on multiple timeframes
The XRP relative strength index (RSI) displays bullish divergence conditions in lower timeframes, according to popular analyst CasiTrades.
A bullish divergence is when the asset’s price prints lower lows, whereas the RSI produces higher lows, indicating that downward momentum is waning.
“After reaching the 0.786 retrace at $2.05, XRP is printing bullish divergences from the 15-min all the way up to the 4-hour chart,” the analyst said in a March 31 post on X.
CasiTrades notes that these signals are a positive indicator both for short-term bounces and potential macro recovery.
“That’s the kind of signal we want to see for both short-term bottom and macro! -the bounce is holding so far!”
XRP/USD hourly chart. Source: CasiTrades
She added that $2.25 remains a key resistance level to watch, as breaching this level with strong momentum would signal a convincing bullish breakout.
“If we break above $2.25 with strong momentum, that would invalidate the need for another support retest—a very bullish sign,” CasiTrades said, adding that the demand zone between “$2.00 and $2.01 remains a support if the $2.05 doesn’t hold.”
The analyst projects a bullish month for XRP in April, with targets of $2.70 and $3.70 in the short term.
“Once the price reaches its target, I expect a large impulse to the upside! Key resistance aligning to $2.70 and $3.80.”
Related: XRP funding rate flips negative — Will smart traders flip long or short?
Is the XRP local bottom in?
Despite XRP’s recent recovery from local lows, the risk of a deeper correction remains, according to veteran trader Peter Brandit.
Last week, Brandt said the presence of a “textbook” head-and-shoulders pattern (H&S) could see XRP price as low as $1.07.
This potential H&S pattern is still in play on the daily chart (see below) and will be completed on a break and close below the neckline at $1.90.
If the price stays below the neckline, the pair could plummet to $1.50 and then to the pattern’s target of $1.07.
Brandt said:
“Below $1.9, I would not want to own it. H&S projects to $1.07. Don’t shoot the messenger.”
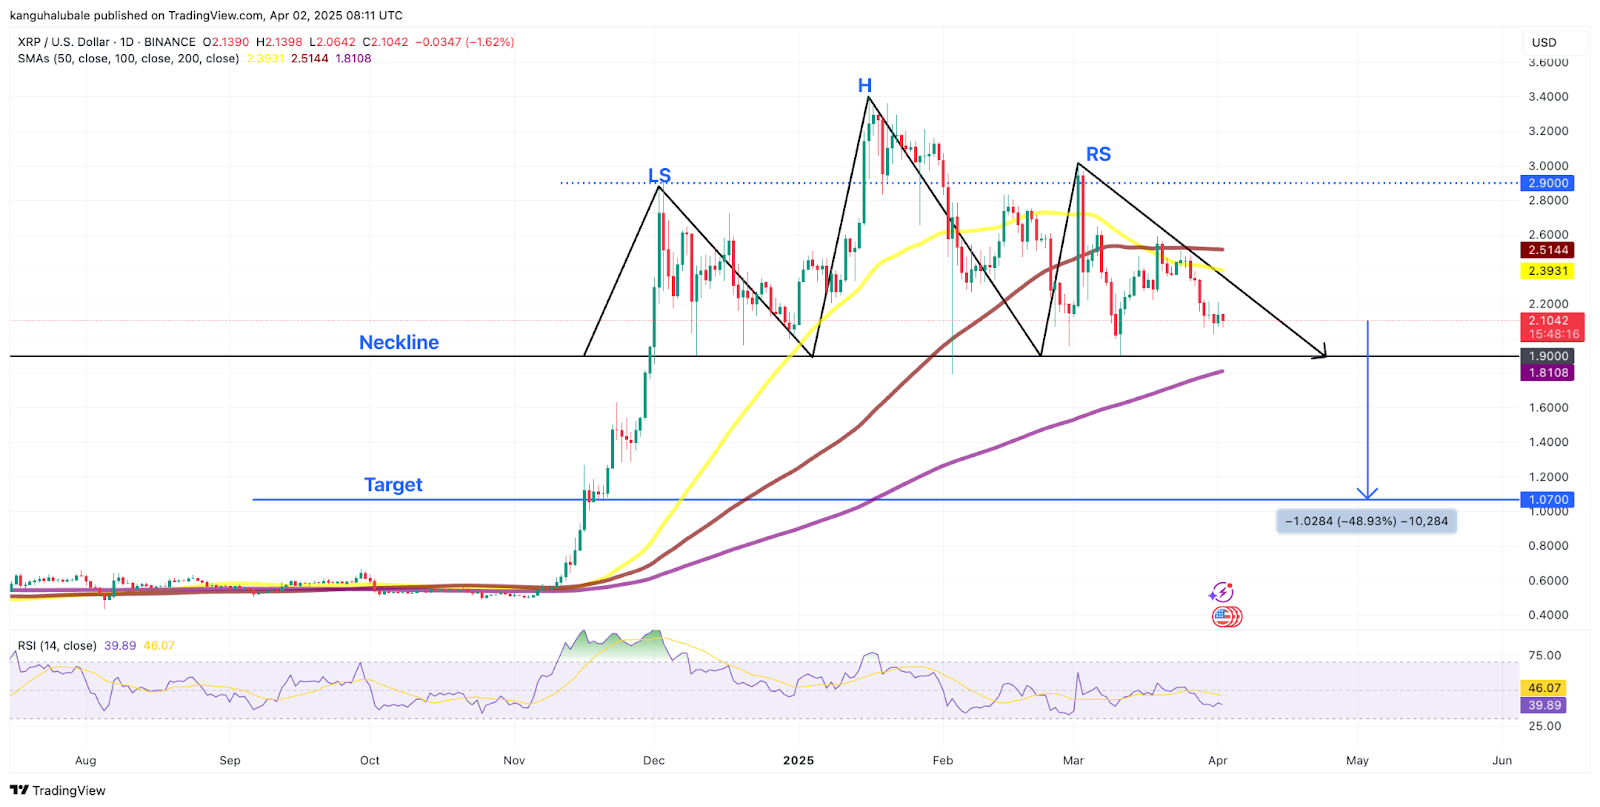
XRP/USD daily chart with H&S pattern. Source: Cointelegraph/TradingView
Brandt states this bearish chart pattern will be invalidated if buyers push and maintain the price above $3.00.
Meanwhile, macroeconomic headwinds from US tariffs on April 2 could spook traders, pulling the XRP price toward $1.31.
But not everyone agrees. Popular analyst Dark Defender, for example, shared a positive outlook, saying that XRP price is likely to revisit the last Fibonacci level at $2.04 before bouncing back again.
According to the analyst, a key resistance level for XRP is $2.22, which “should be broken” to ensure a sustained recovery toward the Wave 5 target at $8.
“April-May will be hot, and our targets of Wave 5 stand at $5-8 levels, as expected.”
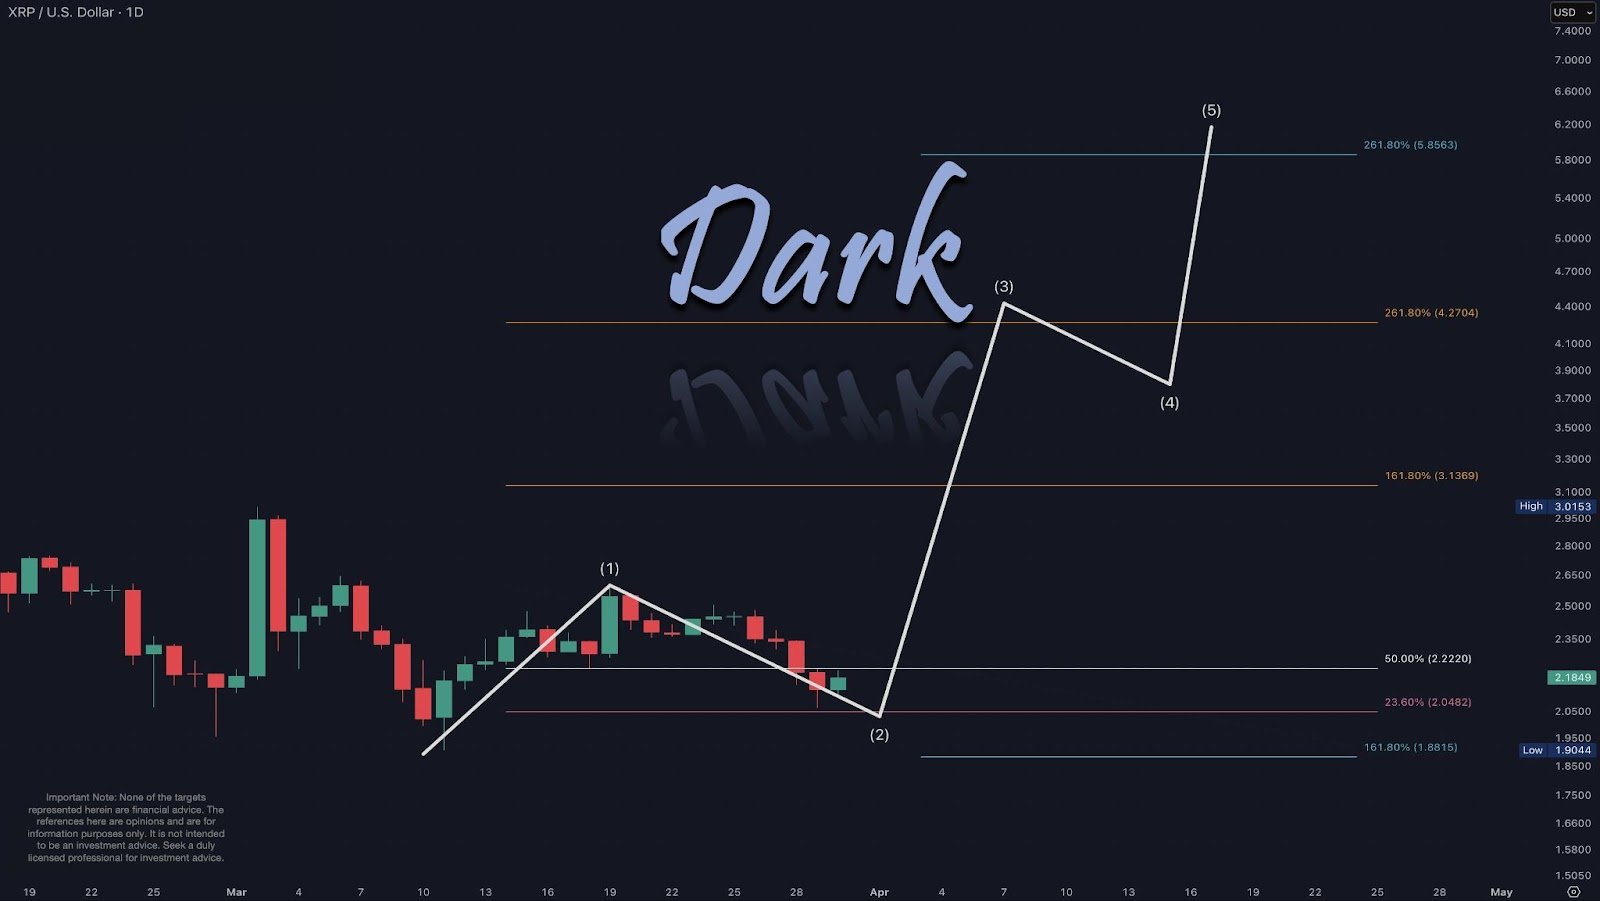
XRP/USD daily chart. Source: Dark Defender
This article does not contain investment advice or recommendations. Every investment and trading move involves risk, and readers should conduct their own research when making a decision.